
From Counting Kids to Changing Outcomes: Data use for non-profits
The non-profit organizaiton I work at collects tons of data. But the ways in which many organizations in the sector tends to be fairly limited. I want to talk about why I think that challenge exits and how we are working to change that fact, putting our data to work improving opportunities for young people1.
Challenge
A lot of infrastructure has been built up in the social service sector around data collection. Our data systems are really good at capturing what is happening in programs. Data entry has been made to be relatively seamless in part because funders have recognized that if you make it challening, program staff just won’t do it.
The same cannot be said for data extraction from these same systems. In general, these prioprietary data sytems are not designed to give direct access to databases. Instead data is extracted by running specific reports. Each report is generally designed to tell you one and one only one thing.
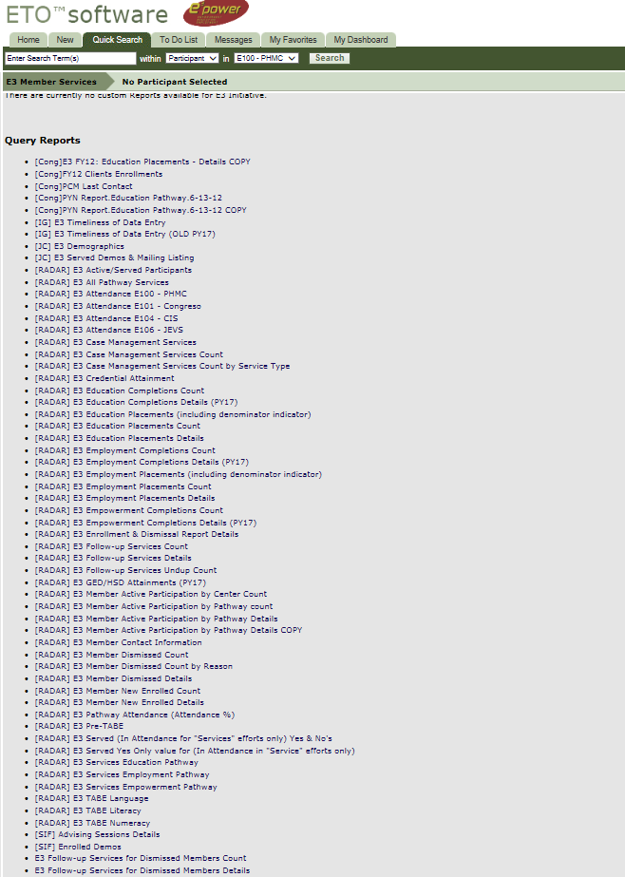
The reason for this is because data use is almost always a compliance exercise. You run a report to tell you how you are doing compared to some pre-determined metric. Typically each metric gets its own report. The image below shows the reports page for just one of our programs. There are over 50 different reports for just that program.
Counting
This method of data extraction lends itself to being only able to use the data for one thing - counting. A lot of data in the social sector tends to be counting how many particiapnts achieved some outcome, for example. You then divide this by a count of the toal and get a percentage.
This is not to deny that counting is frequently a useful method to understand what’s happening in program through its data. The problem becomes when this is the primary use of the data. As an example, many people have identified problems with how test scores have negatively impacted schooling in recent years. In my view this is the quintessential example of counting2: you count how many kids scored above a certain score, count the total who took the test, and then divide. You come out with one number that tells how a classroom, school, or district is performing, but you lose all nuance.
The main problem with using data in this way is that it does not fit the mental models of what the people most directly invovled with programs - direct service staff such as teachers, case managers, program directors, etc. - have about what they are trying to achieve. They have specific, often unspoken, ideas about how the activities of their program lead to the changes that they want for participants. If the data that is presented to them doesn’t interact with the mental models of these staff it doesn’t have any chance of impacting how their practice.
In order to combat this, there are two basic options: shift the mental models or shift the ways in which data is presented. We do a little of both. This post is primarily about how shift the data use to more closely align to staff’s mental models. However, I do think it’s worth a brief word about shifting mental models.
A first step that when presenting data to any program is to clarify mental models. Typically this is done in the social sciences using logic models. And while our approach is similar, logic models tend to be too simplistic to fully capture the ideas that direct service staff have about their work. We work with program staff to develop conceptual frameworks that capture the nuance of how they think about their work. They tend to focus on the activites of the particular program and the shorter-term outcomes that give some immediate feedback about how participants are doing. Long-term outcomes are obviously what we are ultimately striving for but usually come too far in the distance to have a direct impact on decisions that staff make. We tend to rely on external researchers to help us measure impact on those longer-term outcomes while focusing on presenting information which relates more directly to programmatic activities.
Snowball effect
The counting mindset leads to a snowball effect of other issues with data use. First, as we’ve seen, when the data doesn’t intersect with any part of the mental models of the staff, it isn’t able to impact the decisions that those staff are making. When the data isn’t used, the quality starts to suffer. The vast majority of the data that we rely on is entered directly by program staff. When a participant attends a class or achieves an outcome, someone has to go and put that into the system. If the data presented back to them doesn’t seem meaningful, or worse, isn’t presented back at all, motivation to to enter the data will wane. And when the quality of the data suffers, staff will become distrustful of the data. They will know that it doesn’t accurately reflect their efforts because they are the ones entering it. Therefore staff can continue to make decisions based on their prior mental models and will not update them based on the data.
Shifting to tidy data
A substantial focus of our work is to present data analysis to staff in ways that more closely reflects the mental models they have about their programs. Only then can you start to impact the decisions they make about their work.
Doing this requires getting the data into a format that allows you to ask it a broad variety of questions. Here is where the principles of tidy data are invaluable. The basic idea is to get to a format where every row is an observation, every column is a variable, and every table is a level of observation.
Getting the data into the correct format is one of the most important parts of the process. I typically use R to process my data; the benefit of this is that there are a number of packages in the “Tidyverse” which facilitate getting data into a tidy format and moreover, make working with data more straightforward once its in this format. I also believe that using a programming language can increase transparency around data process and increase reproducibility. Nothing is worse than not being able to explain how you came to a specific number or get the same number when you try to run it again. Using R (or another language) helps to alleviate these issues.
In the same way that the reporting/counting mindset creates a snowball of challenges, getting data into a tidy format creates a positive snowball leading to more effective use of the data.
Exploration
One use for data is to tell you how you are doing with things you already care about. This is important. But it should also be able to generate insights into things which are important but you didn’t know about. Getting data into a tidy format makes things much simpler.
A key problem that we’ve experienced is that staff believe there are limitations to the data which are in fact not limitations of the data but of the systems which report that data. Getting data into a tidy format allows you to explore things in a way that weren’t possible previously.
It’s often not possible to guess what staff’s mental models are. Instead, a more effective approach is to present them with different forms of data, unique visualizations, that allow them to think differently about their work. These conversations tend to be pretty superficial at first, but overtime, staff will provide feedback about what is useful to them, what they are interested in seeing, and how small tweaks to reports or charts could lead to big insights.
Processes
However, one-off analyses typically don’t lead to impactful insights. More important than any one analysis are the processes surrounding the data. Routines allow all involved to gain a familiarity with both the data and each other.
One of the key things we do is to put definitions of key metrics at the bottom of each report. This accomplishes two things. First, it increases transparency so that everyone can gain a deeper understanding of what data and how exactly indicators are calculated. Moreover, it provides direct opportunities for feedback on specific items. It allows the conversation to go beyond whether the data itself is “right” to whether the analysis of the data provides genuine insights.
Collaboration
Clear, consistent processes around data reporting and review leads to more opportunities for collaboration. Processes allow the conversation to go beyond reporting metrics and to ask interesting questions about relationships between variables. This allows staff and analysts to provide their unique perspective and delve into questions that can be further explored through existing data or additional data collection.
Conclusion
The social sector seems to be in a in a similar place as journalism was a few years ago. Data journalism arose because it became apparent that traditional models of applying evidence their work were lacking. In journalism, reporters typically reach out to an expert, usually an academic, to get their take on a particular issue. They apply that external expert’s analysis to their work by quoting them in an article. The pioneers of data journalism married the skillset of an academic with the positionality and focus of journalist. Instead of developing a deep expertise in one area, they built skills that allowed them to do their own analysis and communicate it directly with readers.
In my estimation the social sector is ripe for a similar shift. We have very much relied on external experts, academics and contracted evaluators, to tell us how we are doing. These perspectives are immensely valuable and will not go away any time soon just as experts providing quotes for reporters will not go away. However, there is an immense gap that can be filled by more internal analysts. These individuals have the skills to conduct their own analysis, present findings, and communicate results directly to program staff. They bring additional context by doing this full-time, are able establish processes around data review, and focus on influencing decisions of program staff. Most organizations in this sector would benefit from this skill-set immensely.
- This post is modified from a talk I gave at EARL Boston 2017. [return]
- This isn’t to say that the tests themselves are not problematic, just to note that the way that the data is used is also lacking. [return]
