
Comparing NBA teams from the past 20 years
With the NBA season fast-approaching (not fast enough for me), I wanted to play around with some NBA data and explore teams from recent history. My beloved Philadelphia 76ers have made a remarkable rise in the past two years, going from one of the worst teams in history to a contender for the conference championship, so there are some bragging rights invovled in this too.
What’s the best way to rate teams?
The first step was to determine the best empirical measure of a team’s ability. The website Fivethirtyeight uses Elo for their ratings. They have an excellent primer on Elo and decisions they made in creating their NBA rankings as well. They also publish complete Elo ratings since the start of the NBA, but I wanted to create the ratings mayself (while using their ratings as a comparison benchmark).
For those not familar, Elo is a measure of relative ability. A rating of 1500 is average; a team gains points when they win and drops points after a loss. The points gained or lost are relative to the gap between the teams: a team will gain a lot of points for beating a team with a much higher rating but may only gain a few for beating a team with a lower rating.
Elo can be used in to look at trends over time to see how a team’s relative ability rises and falls. It can also be used for prediction: comparing the Elo rating of two teams gives you a probability of each team winning.
I built an application that lets you look at both of those things. On the first tab, you can track any team’s Elo over time using a specified date range. On the second tab, you can pick any two teams to see how they would match up on a given date in the last 20 years. It also shows the actual NBA games that took place on that date and whether the outcome was expected or an upset. You can view the standalone application here.
The rest of this post walks through the process of creating this application. Note that this code is for reference and won’t be reproducible as it’s written on this post. The full source code for the application is available here.
Generating the Elo ratings
Getting the data
First we need to get the data. Basketball Reference is the go-to place for any NBA related data. It’s organized in a way that makes it possible to scrape the data.
I wrote a function to scrape this data. The website is organized by month and year. I wanted to go back about 20 years, but one thing that made this tricky a change in format after the 2000 season (BR added a ‘start time’ column). The function below parses the tables that include data, teams, and final score.
library(tidyverse)
library(elo)
library(rvest)
library(RCurl)


scrape_br <- function(url) {
# function to scrape the data and organize it into a data frame
  # table from older years missing start time
  old_format_years <- "1997|1998|1999|2000"
  old_format <- if_else(grepl(old_format_years, url), TRUE, FALSE)
  table_names <- c("date", "start_time", "visitor", "visitor_pts",
                   "home", "home_pts", "link", "ot", "attendance",
                   "notes")
  if(old_format) num_col <- 9 else num_col <- 10
  # get the table
  tmp <- url %>%
    read_html() %>%
    html_nodes(".right , .left , .center") %>%
    html_text()
  # prep to read as csv
  tmp <- gsub(",", "", tmp) # remove commas for reading as csv
  # add a comma to the end of each field
  tmp <- paste0(tmp, ",")
  # start a new row after each 9/10 element depending on season
  new_rows <- seq(0, length(tmp), by = num_col)
  tmp[new_rows] <- paste0(tmp[new_rows], "\n")
  # collapse to a chacter string then read as csv
  # convert all cols to character, read.csv was reading some in correctly
  dat <- paste0(tmp, collapse = "") %>%
    read.csv(text = .,
             colClasses = rep("character", num_col)) %>%
    filter(PTS != "") # remove rows w/o data
  # clean up column names
  if(old_format) {
    names(dat) <- table_names[table_names != "start_time"]
  } else {
    names(dat) <- table_names
  }
  dat[!is.na(names(dat))]
}
This gets the games for each month. Then we use the map function to get this for all of the months for the past 20 years and combine it into one table.
# create all combinations of months and years
months <- c("october", "november", "december", "january", "february",
            "march", "april", "may", "june")

years <- seq(1997, 2018, by = 1)

season_months <- expand.grid(years, months)

# create a list of urls for scraping data
br_urls <- paste0(
  "https://www.basketball-reference.com/leagues/NBA_",
  season_months$Var1,
  "_games-",
  season_months$Var2,
  ".html"
)

# get only valid urls and scrape
games <- map(br_urls, ~ifelse(RCurl::url.exists(.), ., NA)) %>%
  .[!is.na(.)] %>%
  map(., scrape_br) %>%
  bind_rows()
Calculating the ratings
After some pre-processing of the data, we’re ready to calculate each team’s Elo. The elo package makes this fairly straightforward. The easiest way I’ve found to do this is to use two tables. The first table is games which contains each of the games and results; this is what we scraped from Basketball Reference. The second I called teams, which keeps a running tally of each team’s rating. After each game we append the updated score to the teams table.
We create a base teams table like this1:
teams <- games %>%
  distinct(home_team) %>%
  rename(team = home_team) %>%
  mutate(
    season = if_else(team == "CHA", 2005, 1997),
    elo = if_else(team == "CHA", 1300, 1500),
    date = ymd(paste0(season - 1, "1001"))
  )
We first calculate the Elo within each season. A few things to note here. Fivethirtyeight recommends a 100 point bonus to each home team. However, based on the data from the past 20 years, the home team wins 60% of the time on average. A 70 point difference translates to a 60% win probability, so each home team gets 35 Elo points and each away team gets the same penalty. The value of k represents how much a the Elo should move after each individual result. Setting this at 20 is fairly high, meaning that each result has the potential to move the Elo a lot.
elo_calc_in_season <- function(games, teams) {

  for (i in seq_len(nrow(games))) {
    # function for creating a running elo
    game <- games[i, ]

    # extract most recent elo adding in home/away adjustment
    elo_home <- teams[teams$team == game$home_team, "elo"][[1]] + 35
    elo_vis <- teams[teams$team == game$vis_team, "elo"][[1]] - 35

    elo_update <- elo.calc(
      score(game["home_pts"], game["visitor_pts"]),
      elo_home,
      elo_vis,
      k = 20 # recommended by 538
    )
    # reshape elo update
    new_elo <- elo_update %>%
      gather() %>%
      rename(elo = value) %>%
      mutate(
        team = c(game$home_team, game$vis_team),
        date = game$date,
        season = game$season
      ) %>%
      select(date, team, elo, season)

    # give the home/away adjustment back
    new_elo[1, "elo"] <- new_elo[1, "elo"] - 35
    new_elo[2, "elo"] <- new_elo[2, "elo"] + 35

    # bind elo update to teams data for running list
    teams <- bind_rows(new_elo, teams)
  }
  return(teams)
}
I created a function that calculates the carry over between seasons. Each team keeps 75% of their Elo from each season, gets 25% closer to the average of 1500. Then I created a function that runs the within season and carry over functions together, returning our final teams table.
carry_over <- function(teams) {
# at the start of every new season, carry over 75% of elo
# rec by 538, start new season on 10/01
  new_season <- teams %>%
    filter(season == season[[1]]) %>% # don't include expansions til they join
    distinct(team, .keep_all = TRUE) %>%
    mutate(
      elo = (.75 * elo) + (.25 * 1505),
      date = ymd(paste0(season, "0930")),
      season = season + 1 # add one for start of new season
  )
  bind_rows(new_season, teams)
}

elo_calc <- function(games, teams) {

  seasons <- unique(games$season)

  for (j in seq_len(length(seasons))) {
    # run the calculation within each season
    season_games <- games[games$season == seasons[[j]], ]
    teams <- elo_calc_in_season(season_games, teams)
    # then apply the carryover
    teams <- carry_over(teams)
  }
  return(teams)
}
Finally, we want an Elo for each date of the season (taking out the summer months), not just after games. This is what will allows us to do the hypothetical comparisons. The fill_elo function will give us that.
fill_elo <- function(data) {
  # function to fill in missing elo
  data %>%
    tidyr::complete(date = full_seq(date, period = 1), team) %>%
    arrange(date) %>%
    fill(elo) %>%
    mutate(elo = if_else(month(date) %in% 7:9, NA_real_, elo))
}
Then we run them all together get our complete Elo table which holds our running tally of rankings for hte past two years.
# this will take a few minutes to run
running_elo <- elo_calc(games, teams)

# fill in missing dates
complete_elo <- running_elo %>%
  split(.$team) %>%
  map_dfr(fill_elo) %>%
  mutate(elo = lag(elo)) # get elo at beginning of day instead of end
How does it compare?
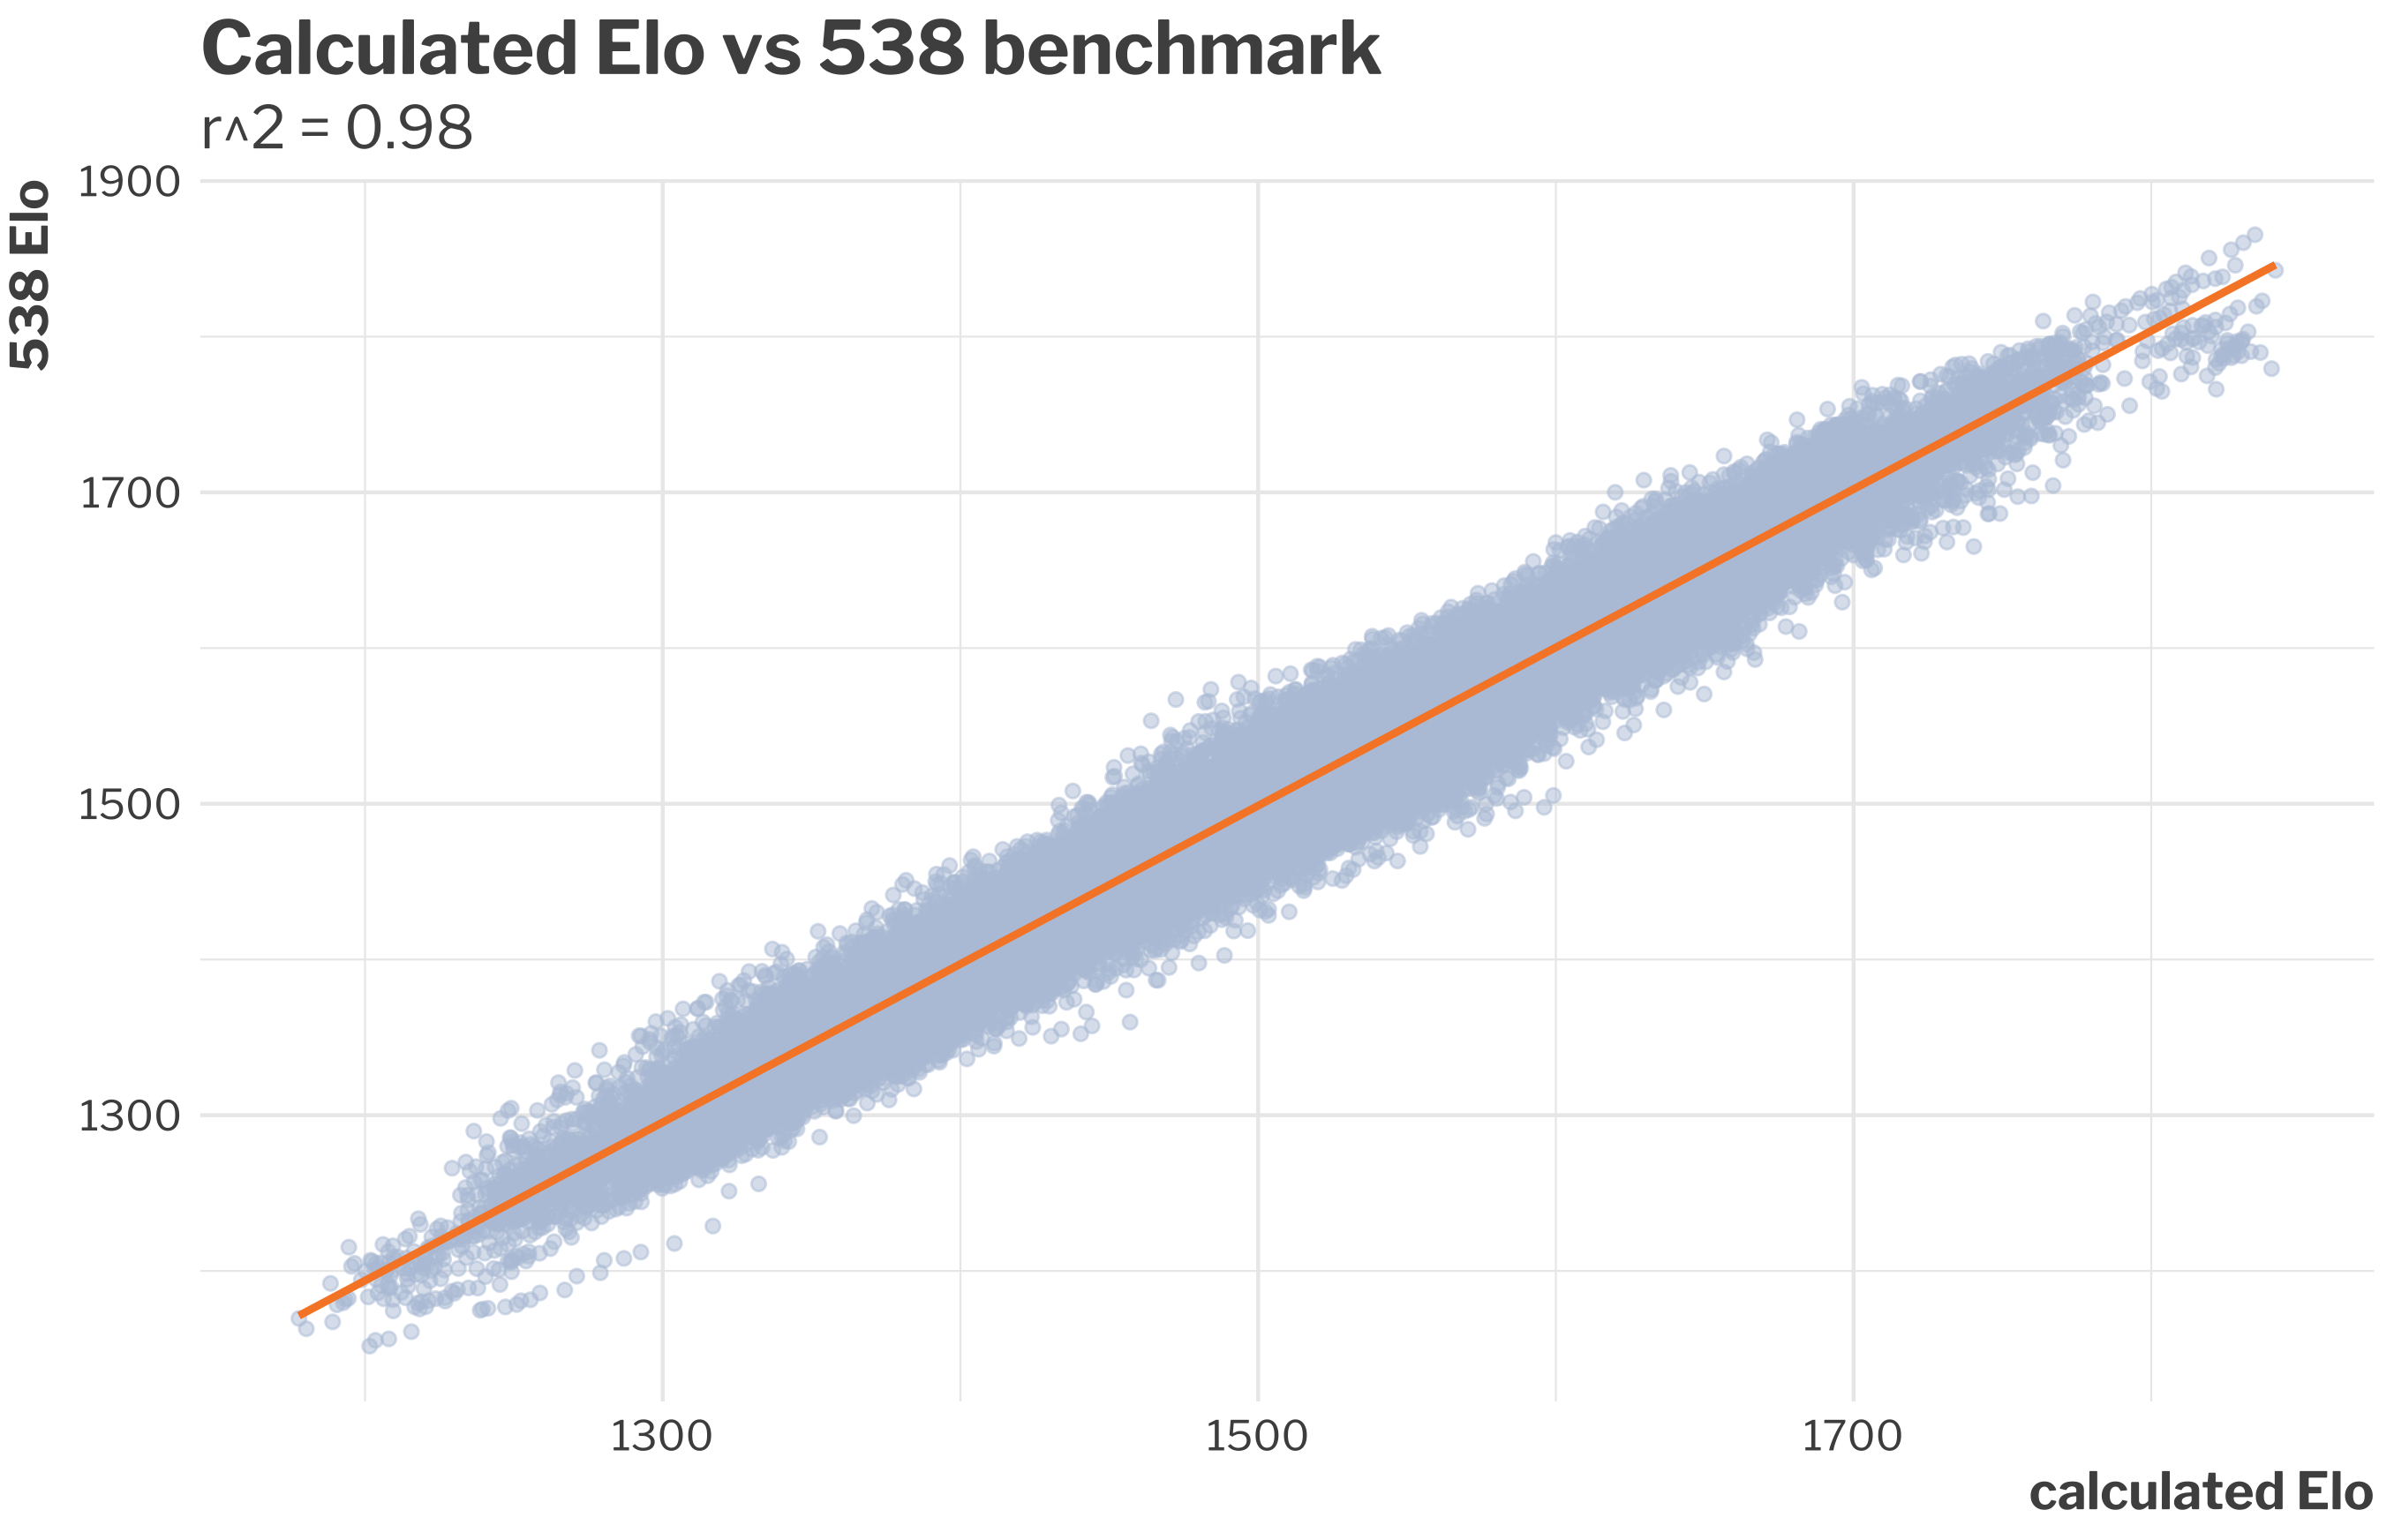
The image above shows the comparison my calculated Elo scores and the Fivethirthyeight scores as a benchmark. The r^2 is about .98 so it looks like I was able to match it farily closely. I used 1997 as my base year and eliminated that from most of my analyses; this gave my ratings some time to even out.
Updates to the application
While I’m pretty happy with how the application turned out, there’s still a few updates I’d like to make.
- Logos: the logos on the ‘compare’ tab are currently being pulled from stats.nba.com. This only gives the current logos, so teams that moved get the logo of their franchise. For example, the logo for the New Jersey Nets is Brooklyn’s logo. At some point I would like to get each team a logo. Maybe I could even get correct logos based on the date that is selected as well!
- Elo by season: I’d like to give the option of looking at a team’s Elo based on season in addition to date range. For this verison, I found date range to be the better option because it allows more flexibility and is more intuitive.
- Real-time results: Once the season is underway, we could look at how ratings change after each game. This would just be a matter of including current data when we scrape it.
I welcome feeback on the applicaiton or data collection. Thoughts on things to add? Ways to improve the code or make it run faster? Feel free to leave them in the comments.
Charlotte was an expansion team and starts with an Elo of 1300. Everyone else starts at 1500 in the 1997 season.↩
